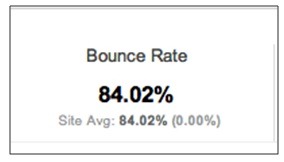
Looking at your site’s bounce rate is great indication of performance: you can work out how relevant your pages are to those finding your site via Google, plus it will help you plan a strategy for better optimization, which can lead to more conversions.
In this article, we will conduct some basic bounce rate analysis in Google Analytics – for the sake of this article, we will be using the newest version. Feel free to follow along!
If you’re unsure what bounce rate is and why it’s important, please visit Google.
Let’s get started:
First, you will need to select a period of time to measure. This could be a week, a month or even a year – it’s not too important, so just choose something that is significant to you. For example, the period since the last re-design or simply select the last full calendar month. You will also finding clicking the “compare to past” button may help with analysis if you suspect your website is not performing as well as it used to.
Analysing your site’s bounce rate:
In analytics, go to Content ==> Site Content ==> Pages

Look for your bounce rate average, halfway down the page, under the graph. Anything under 50-60% is typical, but it can vary depending on the type of website you run.
Is your overall bounce rate higher? This is a strong indication that your site is underperforming.
So, let’s take a closer look why that could be:
Order your pages by bounce rate and then click “show extra rows” to bring up as many pages as possible in the table. Scroll down through the pages with the highest bounce rate, until you see pages with a substantial amount of unique visitors (see table below for an example). These are your problem pages causing the high bounce rate. These pages are your site’s underperformers!
Note down which pages are underperforming and think about why they’re not working. The case study below will provide you with a few diagnostic examples.
Case study:

The page I found from my own site’s analytics has almost 500 unique page views and a whopping 83% bounce rate for the last week. In previous weeks, it also reached the staggering heights of 94%! Ouch!
This shows me right away that this page is vastly underperforming – nearly all the visitors landing on this page are “bouncing off” the page straight away. But why?
Quick analysis shows most people are landing on this page via a Google search. So, the obvious problem could be that we’re not giving people what they’re looking for.
You can replicate this analysis too: click the “secondary dimension” button and type in “keyword”. Click that option to see how people are arriving at your page.
I can see over 300 people arrived on this page using a very broad keyword that I wouldn’t have necessarily chosen myself. This was a blog post and thankfully not a product in the catalog. The topic of the site is very niche and the broad keyword may attract people who are looking for something we cannot provide. At least this tells me I should not worry about further optimizing for that keyword with SEO – it’s just a blog post that is ranking for something I wouldn’t have optimized for anyway! Instead, I will look at which keywords and pages have a lower bounce rate and a better chance of converting and focus on optimizing those. You should try this too!
Remember to cross-reference keywords with conversions in Analytics – if it’s not bringing you any sales, it might be time to ditch it and move on!
Other reasons your bounce rate might be too high:
· Your site is not aesthetically pleasing
· Your website looks spammy or untrustworthy
· People can’t quickly figure out (within 2 or 3 seconds) what your website does, what it is for, or what it sells.
· It is not what people expect – is your meta description (intentionally or unintentionally) misleading?


